
U.S. Travel's Research Trends from David Huether
- Overall Economy
The U.S. economy maintained steady growth as 2020 began: initial estimates showed that real GDP grew by 2.3% in 2019, and a stellar labor market and steady consumer spending underpinned solid economic growth prospects. However, January also brought new global headwinds to the U.S. economy, including the global coronavirus outbreak.
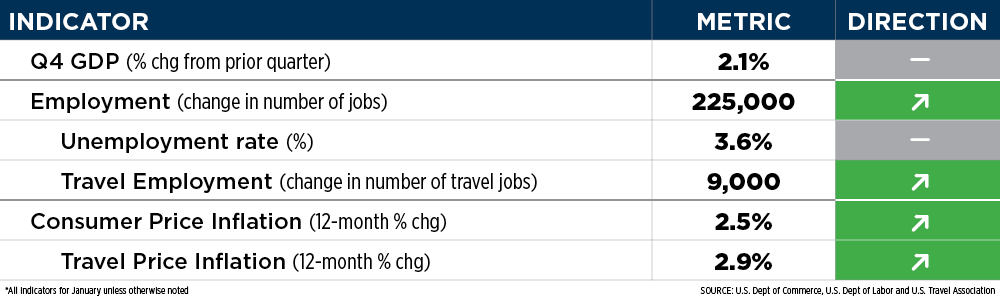
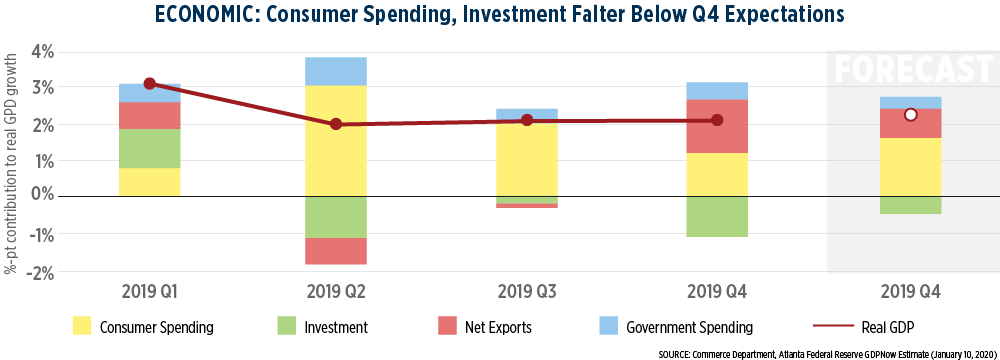
As expected, the U.S. economy grew at a moderate pace in 2019, with final Q4 data showing a 2.1% annualized growth rate. As a result, the initial estimate for total 2019 real GDP growth is a healthy 2.3%. However, the composition of Q4 GDP growth was different from expectations, as outlined in the chart below:
As Q1 2020 economic indicators began to be released, the economy remained strong and poised to absorb potential economic shocks, even from the ongoing coronavirus outbreak. The U.S. labor market was stellar in January, adding 225,000 jobs (9,000 of which were travel jobs) and keeping unemployment under 4%. More importantly, wage growth moved above the 3% mark, meaning that consumers were better prepared to meet an estimated 2.5% y/y increase in prices in January. In addition, the manufacturing sector escaped its slump by meeting new demand orders and consumer confidence remained high to start the year.
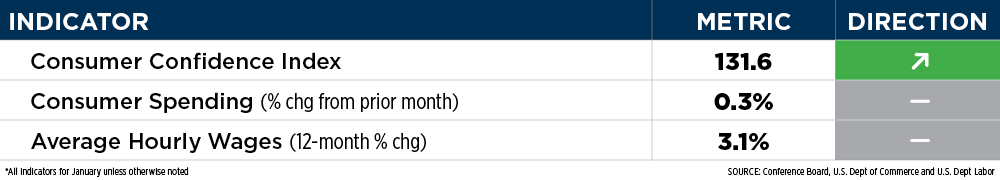
Consumer confidence started the year by rising to a five-month high. The consumer confidence report was highlighted by a strong labor market that inspired short-term confidence, which implied that consumers are ready to spend in 2020. While the consumer remained confident about the future, consumer spending releases for December and January showed a cautious real-time consumer. December consumer spending increased by a modest 0.3% m/m to finish 2019, slowing down from the 0.4% increase in November spending. Advance retail spending for January remained muted: sales excluding automobiles, gasoline, building and food services increased by 0.3% m/m in January, and clothing stores experienced their largest monthly decline in receipts (-3.1%) since March 2009.
Price levels also remained muted. January core prices in the Consumer Price Index (CPI), excluding food and energy items, stayed at 2.3% y/y for the fourth consecutive month. Despite the relative flatness of current price levels, inelastic consumer products (such as rent and insurance) have gone through large price increases and could curtail consumer spending into 2020. January travel prices, as measured by U.S. Travel's Travel Price Index, increased by 2.9%, 0.4 percentage point faster than headline CPI over the same period. The increase was driven by a 13% y/y increase in motor fuel prices. While gas is much more expensive than in January 2019, gas prices actually fell by an unexpected 1.3% since December.
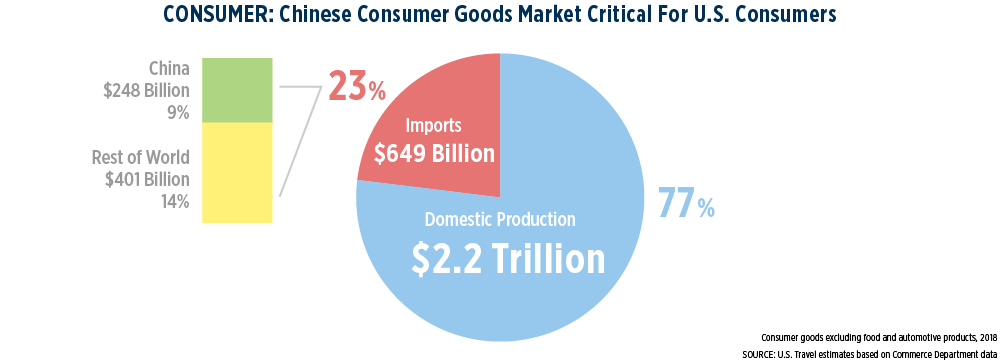
Looking ahead, the continued outbreak of coronavirus is definitely concerning for prices of consumer goods. While the Federal Reserve remains cautious about the full scale of an economic quarantine of Chinese products, the concern underscores the critical importance of Chinese goods to American consumer markets: excluding food and automotive products, Chinese imported goods make up over one-third of all consumer goods imports into the U.S. and represent 9% of total U.S. consumer goods spending. Any major disruption of this trade could potentially have an impact on the American consumer. The recent coronavirus outbreak may also negatively impact consumer confidence moving forward: over 10% of all adults and almost 30% of frequent flyers surveyed reported that the coronavirus outbreak would affect their travel plans within the next three months, according to the Morning Consult.
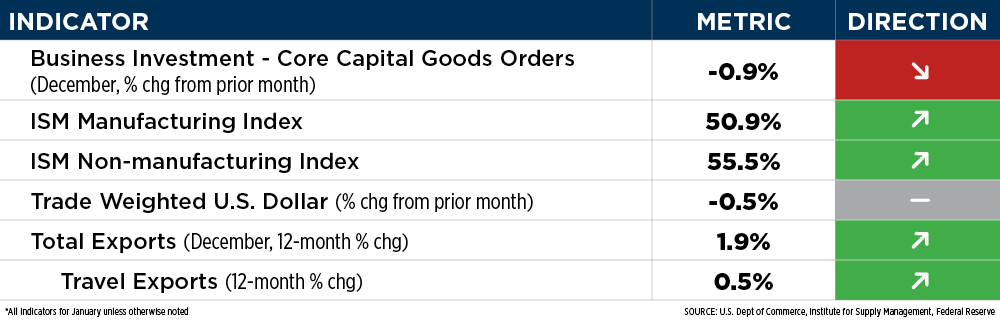
Business investment indicators remained out of sync with consumer spending, continuing to hold back longer-term macroeconomic gains during the economic expansion. New orders for key U.S.-made capital goods dropped the most in eight months in December, suggesting that business investment contracted further at the end of Q4 2019. Core capital goods orders fell by 0.9% to finish the year, a sharp downturn from the meager 0.1% m/m increase posted in November. Overall, business investment has contracted for two straight quarters, subtracting a full percentage point from GDP growth in the fourth quarter. A sustained decline in business investment could have negative implications for business travel in the near-term.
On the other hand, foreign orders for U.S. goods posted a slight rebound as trade restrictions expected to be levied in December were eased during Phase 1 trade agreement negotiations between the U.S. and China. U.S. exports increased by $1.6 billion in December to their highest estimate in seven months (though this was driven mostly by crude oil exports); imports also increased by a much larger $6.8 billion. Despite the increase in international trade volume, the 2019 annual trade deficit fell for the first time in six years due largely to a $12.5 billion decline in imports.
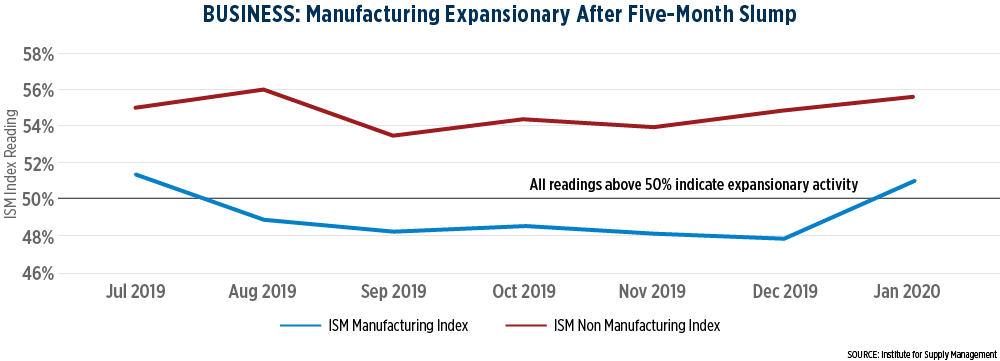
Early 2020 indicators point towards stronger business activity, as the manufacturing sector expanded for the first time in six months. The Institute for Supply Management's Manufacturing PMI index shot up 3.1 percentage points in January to 50.9% (any reading above 50% indicates expansionary activity). The surge in manufacturing activity was led by increases in demand and production: many industry respondents were upbeat about global demand for the first time in months. Services sector activity also increased as the ISM Non-Manufacturing Index rose by 0.6 percentage points to 55.5%. Two travel-related sectors (accommodation & food services, retail trade) reported an increase in business activity, while arts, entertainment & recreation declined.
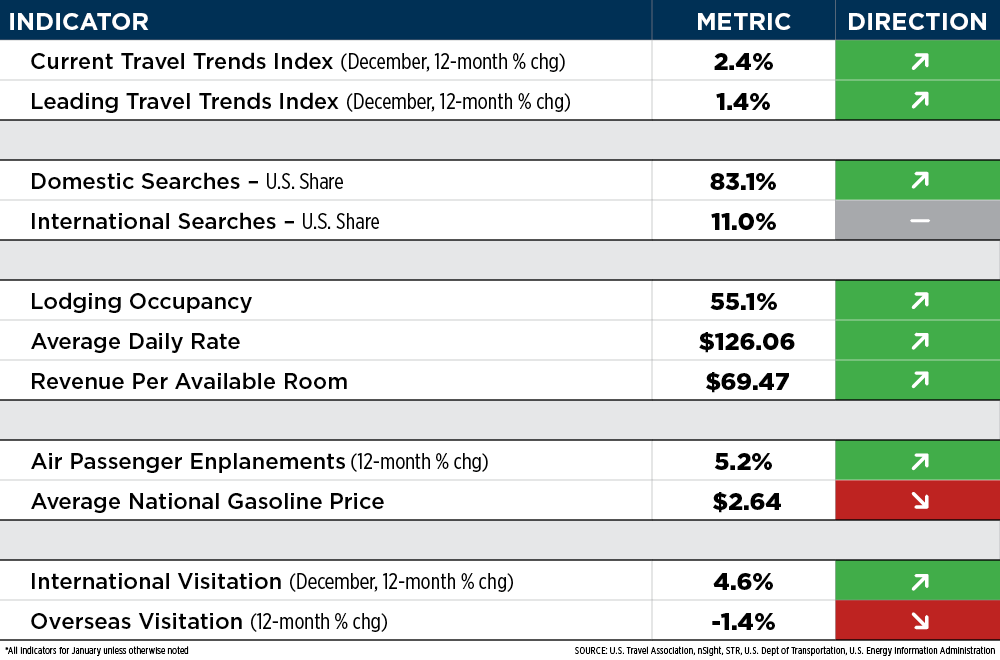
Travel to and within the United States grew 2.4% y/y in December, marking the industry's 10th consecutive year of expansion, according to the U.S. Travel Association's latest Travel Trends Index (TTI). The Leading Travel Index (LTI), a measure of the future direction and pace of travel to and within the U.S., projects that overall U.S. travel volume will grow 1.4% y/y through June 2020.
Domestic travel was once again the bright spot of the TTI as December concluded the third consecutive year of simultaneous expansions in both the domestic leisure and domestic business travel segments. Domestic travel demand rose by 2.6% in December, fueled by increases in domestic leisure travel (2.8%) and business travel (2.0%). The LTI projects that overall domestic travel growth will expand by 1.4% y/y through June 2020.
International inbound travel is expected to contract (-0.2%) over that same time period as a result of the continued strength of the U.S. dollar versus other key currencies and trade tensions. International inbound travel did expand slightly in December (0.8%)—only the second increase for the segment in the past seven months.
The share of Americans searching for lodging within the U.S. reached 83% in January – up from the 81% searching for domestic lodging in January 2019, according to the latest U.S. Travel Barometer. The U.S. captured 11% of international searches in January, on par with January of last year. Domestic travelers favored travel to the southeast region, while international travelers were split between the far west, mideast and southeast regions.
The lodging industry started January 2020 off on a positive note with records across all three key performance metrics and substantial y/y growth, according to STR. The industry is bracing itself for the potential impact of the coronavirus outbreak, but even recent February weekly data has shown no noticeable impact. Gateway cities are expected to begin seeing a significant drop in Chinese arrivals in the coming weeks, which will negatively impact STR's 2020 RevPAR flat forecast of 0% growth.
Baby Boomers are anticipating they will take an average of three or four domestic trips in 2020, according to AARP's 2020 Baby Boomer Travel Trends report. The most popular trips are family trips, weekend getaways and summer vacations. Boomers are also anticipating that they will spend an average of $7,800 on vacations in 2020, a significant increase over 2019 ($6,600).
Group business bookings were soft in Q4 2019 even before the coronavirus outbreak. The latest Cvent group business outlook revealed tepid demand for group bookings in Q4, corresponding to flat business investment. Event duration, peak size and the size of group room blocks all decreased and were the lowest they have been since the launch of the group business outlook in 2018.
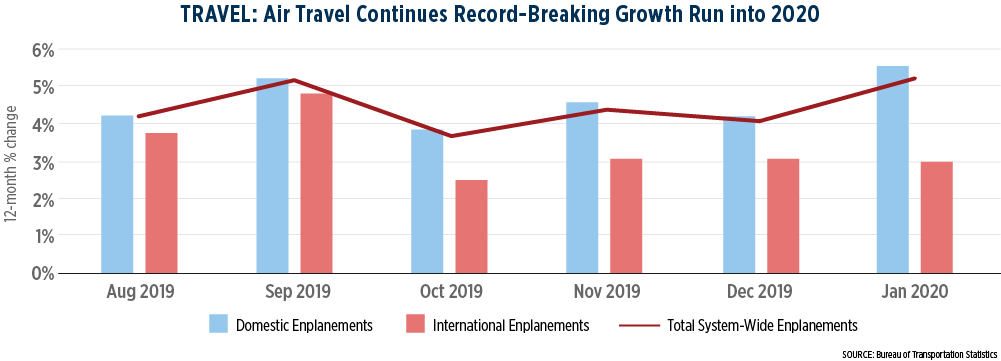
Nearly 79 million passengers boarded flights on U.S. airlines in January 2020, according to recently released estimates from the U.S. Department of Transportation. Air travel demand records continue to be broken in the new year. January's 5.2% y/y increase in passenger demand represents the highest all-time enplaned passenger count for the month. Demand was driven by domestic passengers: the 68.9 million passengers enplaned on domestic flights represented a 5.5% increase from January 2019, whereas international passengers on U.S. flights also increased by 2.9% to 9.7 million.
The average U.S. gas price was $2.64 per gallon for the month of January, according to the U.S. Department of Energy. January gasoline prices remained relatively level with the December average, but 30 cents above average gas prices from a year ago. AAA estimates that the year-over-year gas price gap is shrinking. As of February 10, AAA's average gas price estimate is 16 cents more expensive than last year, the smallest y/y difference seen in two months. Low crude oil prices, steady gasoline stock levels and lower gasoline demand explain the current decreases in gas prices. Decreasing global travel demand due to the coronavirus outbreak could also push down crude oil costs moving forward, keeping prices low into 2020.
New revenue, performance, supply and demand forecasts from multiple sources including STR, CBRE Hotels Research and Kalibri Labs reflect a U.S. hotel industry dealing with a lack of pricing power amid a relatively stable economy and persistent demand. STR and Tourism Economics "slightly downgraded" their 2020 revenue-per-available-room growth forecast from 0.5% growth to zero growth.
STR revised its 2020 supply forecast down from 2% to 1.9% growth, largely due to rooms taking longer than anticipated to come online. At the same time, STR revised their demand forecast up slightly to 1.6% in light of a continued strong economy.
Over 79 million international visitors traveled the U.S. in 2019, according to the National Travel and Tourism Office. 2019 annual international inbound visitation fell slightly from 2018 visitation (-0.6%), making for only the second year in the past 10 where annual international travel to the U.S. has decreased. The drop in visitation is due mostly to annual decreases in visits from Canada (-3.5%) and Mexico (-1.3%); overseas visitation increased 1.3% to 40.4 million. While annual visitations are down, monthly trends have shown that international visitation has recovered from the slump it endured in the first half of 2019. Nearly 6.9 million international visitors traveled to the U.S. in December, the largest recorded visitation numbers for the month of December and a 4.6% increase from December 2018. Coincidentally, December 2019 was the first month in 2019 where Canadian, Mexican, and overseas visitations all increased against year-ago levels. However, overseas visitations are down 1.4% y/y in January 2020.
U.S. Travel recently updated its Travel and Trade fact sheet based on the latest 2019 data released from Department of Commerce.
Coronavirus (COVID-19) Toolkit: Industry resources available, including recommended messaging to travelers and the media as well as links to the latest news and guidance from official health organizations and government sources.
Travel Facts & Figures: Quick overview of statistics on travel-related topics.
Preparing for Destination Capitol Hill – Tuesday, March 10th 2:45-3:30pm EST
U.S. Travel's public affairs team will provide an overview of current legislative priorities and will arm you with specific asks to take to your Destination Capitol Hill meetings. Register for the webinar here. If you haven't registered for DCH yet, you can do so at U.S. Travel's website.