Our Impact
FACT SHEET April 26, 2023
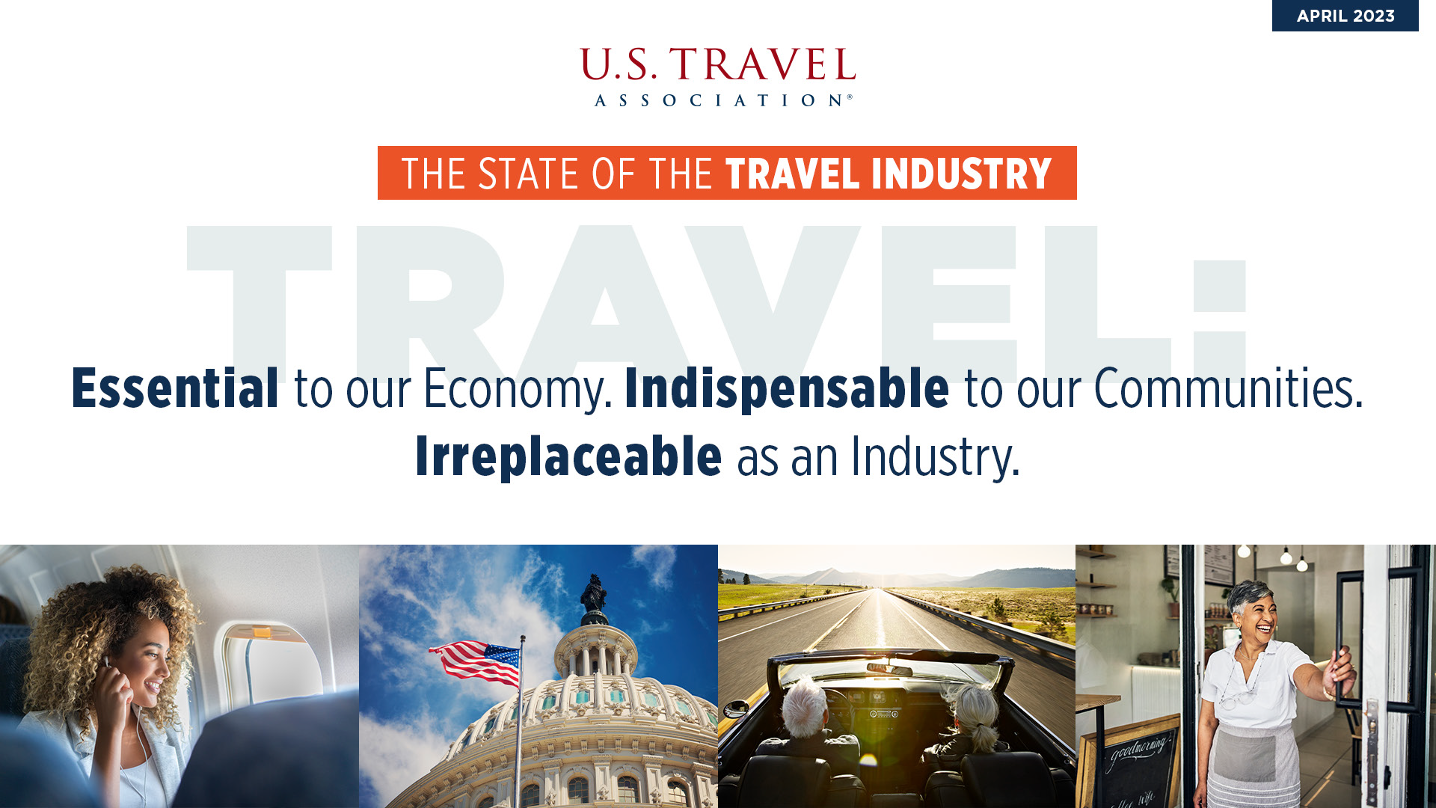
Travel is essential to driving economic growth and job creation in states, destinations and communities across America, and it is indispensable to our nation’s global competitiveness.
In 2023, travelers in the United States directly spent $1.3 TRILLION, which produced an economic footprint of $2.8 TRILLION and supported more than 15 million American jobs.